Runner fleet dashboard for administrators
- Tier: Ultimate
- Offering: GitLab Self-Managed
Version history
- Introduced in GitLab 16.6
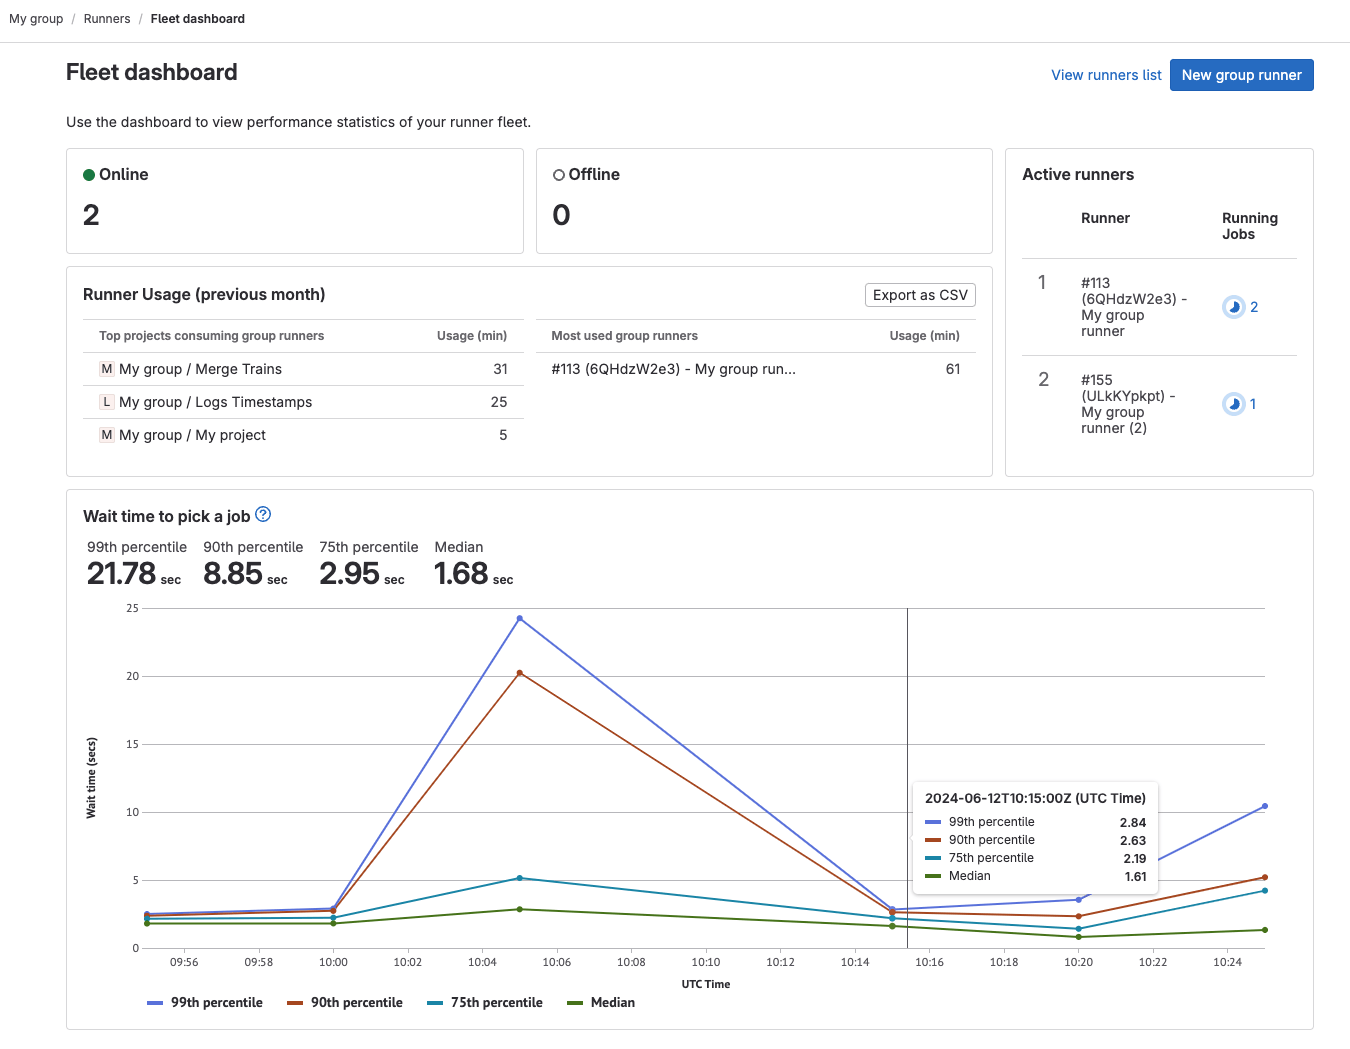
As a GitLab administrator, you can use the runner fleet dashboard to assess the health of your instance runners. The runner fleet dashboard shows:
- Recent CI errors caused by runner infrastructure
- Number of concurrent jobs executed on most busy runners
- Compute minutes used by instance runners
- Job queue times
Dashboard metrics
Version history
-
Introduced metrics, Runner usage and Wait time to pick up job, as an experiment in GitLab 16.7 with flags named
ci_data_ingestion_to_click_houseandclickhouse_ci_analytics. Disabled by default. - Runner usage and Wait time to pick up job metrics changed to beta in GitLab 17.1.
The following metrics are available in the runner fleet dashboard:
To view Runner usage and Wait time to pick a job metrics, you must configure the ClickHouse integration.
For an overview, see setting up runner fleet dashboard with ClickHouse.
| Metric | Description |
|---|---|
| Online | Number of runners that are online for the entire instance. |
| Offline | Number of runners that are currently offline. Runners that were registered but never connected to GitLab are not included in this count. |
| Active runners | The total number of runners that are currently active. |
| Runner usage (previous month)1 | Requires ClickHouse: The total compute minutes used by each project or group runner in the previous month. You can export this data as a CSV file for cost analysis. |
| Wait time to pick a job1 | Requires ClickHouse: The average time a job waits in the queue before a runner picks it up. This metric provides insights into whether your runners are capable of servicing the CI/CD job queue in your organization's target service-level objectives (SLOs). This data is updated every 24 hours. |
Footnotes:
- This feature is in beta and subject to change without notice. For more information, see epic 11180.
View the runner fleet dashboard
Prerequisites:
- You must be an administrator.
- To view metrics for Runner usage and Wait time to pick a job, you must configure the ClickHouse integration.
To view the runner fleet dashboard:
- In the upper-right corner, select Admin.
- Select Runners.
- Select Fleet dashboard.
Export compute minutes used by instance runners
Prerequisites:
- You must have administrator access to the instance.
- You must configure the ClickHouse integration.
To analyze runner usage, you can export a CSV file that contains the number of jobs and executed runner minutes. The CSV file shows the runner type and job status for each project. The CSV is sent to your email when the export is completed.
To export compute minutes used by instance runners:
- In the upper-right corner, select Admin.
- Select Runners.
- Select Fleet dashboard.
- Select Export CSV.
Feedback
To help us improve the runner fleet dashboard, you can provide feedback in issue 421737. In particular:
- How easy or difficult it was to set up GitLab to make the dashboard work.
- How useful you found the dashboard.
- What other information you would like to see on that dashboard.
- Any other related thoughts and ideas.